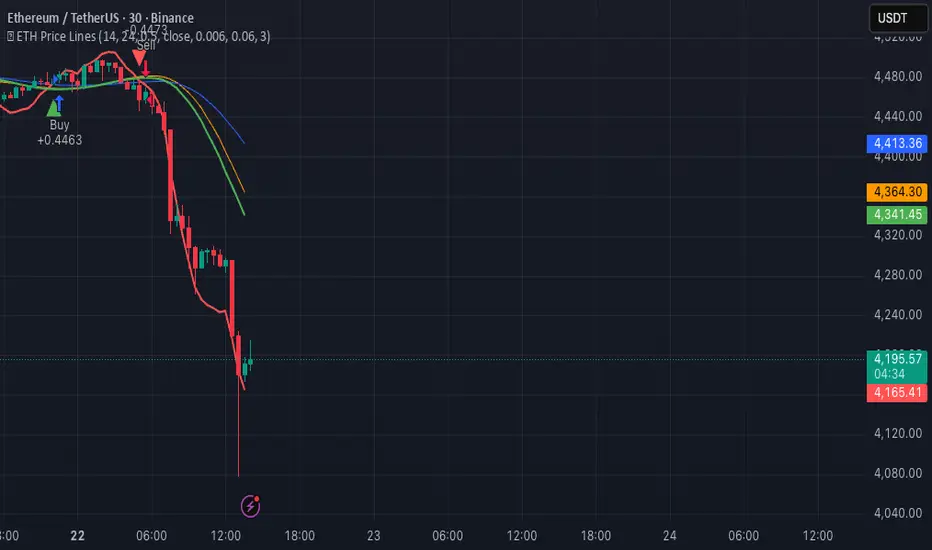
🚀 ETH Price LinesThis Pine Script strategy ("🚀 ETH Price Lines") does:
Trend detection with short & long SMAs
Noise reduction using Kalman filters
Signal confirmation from ADX (trend strength) + volume
Entry/exit:
Buy when short-term crosses above long-term
Sell when it crosses below
Risk management: optional stop-loss (default 3%)
Visuals: plots SMAs, Kalman lines, buy/sell markers, and triggers alerts
Search in scripts for "Buy sell"
EvoTrend-X Indicator — Evolutionary Trend Learner ExperimentalEvoTrend-X Indicator — Evolutionary Trend Learner
NOTE: This is an experimental Pine Script v6 port of a Python prototype. Pine wasn’t the original research language, so there may be small quirks—your feedback and bug reports are very welcome. The model is non-repainting, MTF-safe (lookahead_off + gaps_on), and features an adaptive (fitness-based) candidate selector, confidence gating, and a volatility filter.
⸻
What it is
EvoTrend-X is adaptive trend indicator that learns which moving-average length best fits the current market. It maintains a small “population” of fast EMA candidates, rewards those that align with price momentum, and continuously selects the best performer. Signals are gated by a multi-factor Confidence score (fitness, strength vs. ATR, MTF agreement) and a volatility filter (ATR%). You get a clean Fast/Slow pair (for the currently best candidate), optional HTF filter, a fitness ribbon for transparency, and a themed info panel with a one-glance STATUS readout.
Core outputs
• Selected Fast/Slow EMAs (auto-chosen from candidates via fitness learning)
• Spread cross (Fast – Slow) → visual BUY/SELL markers + alert hooks
• Confidence % (0–100): Fitness ⊕ Distance vs. ATR ⊕ MTF agreement
• Gates: Trend regime (Kaufman ER), Volatility (ATR%), MTF filter (optional)
• Candidate Fitness Ribbon: shows which lengths the learner currently prefers
• Export plot: hidden series “EvoTrend-X Export (spread)” for downstream use
⸻
Why it’s different
• Evolutionary learning (on-chart): Each candidate EMA length gets rewarded if its slope matches price change and penalized otherwise, with a gentle decay so the model forgets stale regimes. The best fitness wins the right to define the displayed Fast/Slow pair.
• Confidence gate: Signals don’t light up unless multiple conditions concur: learned fitness, spread strength vs. volatility, and (optionally) higher-timeframe trend.
• Volatility awareness: ATR% filter blocks low-energy environments that cause death-by-a-thousand-whipsaws. Your “why no signal?” answer is always visible in the STATUS.
• Preset discipline, Custom freedom: Presets set reasonable baselines for FX, equities, and crypto; Custom exposes all knobs and honors your inputs one-to-one.
• Non-repainting rigor: All MTF calls use lookahead_off + gaps_on. Decisions use confirmed bars. No forward refs. No conditional ta.* pitfalls.
⸻
Presets (and what they do)
• FX 1H (Conservative): Medium candidates, slightly higher MinConf, modest ATR% floor. Good for macro sessions and cleaner swings.
• FX 15m (Active): Shorter candidates, looser MinConf, higher ATR% floor. Designed for intraday velocity and decisive sessions.
• Equities 1D: Longer candidates, gentler volatility floor. Suits index/large-cap trend waves.
• Crypto 1H: Mid-short candidates, higher ATR% floor for 24/7 chop, stronger MinConf to avoid noise.
• Custom: Your inputs are used directly (no override). Ideal for systematic tuning or bespoke assets.
⸻
How the learning works (at a glance)
1. Candidates: A small set of fast EMA lengths (e.g., 8/12/16/20/26/34). Slow = Fast × multiplier (default ×2.0).
2. Reward/decay: If price change and the candidate’s Fast slope agree (both up or both down), its fitness increases; otherwise decreases. A decay constant slowly forgets the distant past.
3. Selection: The candidate with highest fitness defines the displayed Fast/Slow pair.
4. Signal engine: Crosses of the spread (Fast − Slow) across zero mark potential regime shifts. A Confidence score and gates decide whether to surface them.
⸻
Controls & what they mean
Learning / Regime
• Slow length = Fast ×: scales the Slow EMA relative to each Fast candidate. Larger multiplier = smoother regime detection, fewer whipsaws.
• ER length / threshold: Kaufman Efficiency Ratio; above threshold = “Trending” background.
• Learning step, Decay: Larger step reacts faster to new behavior; decay sets how quickly the past is forgotten.
Confidence / Volatility gate
• Min Confidence (%): Minimum score to show signals (and fire alerts). Raising it filters noise; lowering it increases frequency.
• ATR length: The ATR window for both the ATR% filter and strength normalization. Shorter = faster, but choppier.
• Min ATR% (percent): ATR as a percentage of price. If ATR% < Min ATR% → status shows BLOCK: low vola.
MTF Trend Filter
• Use HTF filter / Timeframe / Fast & Slow: HTF Fast>Slow for longs, Fast threshold; exit when spread flips or Confidence decays below your comfort zone.
2) FX index/majors, 15m (active intraday)
• Preset: FX 15m (Active).
• Gate: MinConf 60–70; Min ATR% 0.15–0.30.
• Flow: Focus on session opens (LDN/NY). The ribbon should heat up on shorter candidates before valid crosses appear—good early warning.
3) SPY / Index futures, 1D (positioning)
• Preset: Equities 1D.
• Gate: MinConf 55–65; Min ATR% 0.05–0.12.
• Flow: Use spread crosses as regime flags; add timing from price structure. For adds, wait for ER to remain trending across several bars.
4) BTCUSD, 1H (24/7)
• Preset: Crypto 1H.
• Gate: MinConf 70–80; Min ATR% 0.20–0.35.
• Flow: Crypto chops—volatility filter is your friend. When ribbon and HTF OK agree, favor continuation entries; otherwise stand down.
⸻
Reading the Info Panel (and fixing “no signals”)
The panel is your self-diagnostic:
• HTF OK? False means the higher-timeframe EMAs disagree with your intended side.
• Regime: If “Chop”, ER < threshold. Consider raising the threshold or waiting.
• Confidence: Heat-colored; if below MinConf, the gate blocks signals.
• ATR% vs. Min ATR%: If ATR% < Min ATR%, status shows BLOCK: low vola.
• STATUS (composite):
• BLOCK: low vola → increase Min ATR% down (i.e., allow lower vol) or wait for expansion.
• BLOCK: HTF filter → disable HTF or align with the HTF tide.
• BLOCK: confidence → lower MinConf slightly or wait for stronger alignment.
• OK → you’ll see markers on valid crosses.
⸻
Alerts
Two static alert hooks:
• BUY cross — spread crosses up and all gates (ER, Vol, MTF, Confidence) are open.
• SELL cross — mirror of the above.
Create them once from “Add Alert” → choose the condition by name.
⸻
Exporting to other scripts
In your other Pine indicators/strategies, add an input.source and select EvoTrend-X → “EvoTrend-X Export (spread)”. Common uses:
• Build a rule: only trade when exported spread > 0 (trend filter).
• Combine with your oscillator: oscillator oversold and spread > 0 → buy bias.
⸻
Best practices
• Let it learn: Keep Learning step moderate (0.4–0.6) and Decay close to 1.0 (e.g., 0.99–0.997) for smooth regime memory.
• Respect volatility: Tune Min ATR% by asset and timeframe. FX 1H ≈ 0.10–0.20; crypto 1H ≈ 0.20–0.35; equities 1D ≈ 0.05–0.12.
• MTF discipline: HTF filter removes lots of “almost” trades. If you prefer aggressive entries, turn it off and rely more on Confidence.
• Confidence as throttle:
• 40–60%: exploratory; expect more signals.
• 60–75%: balanced; good daily driver.
• 75–90%: selective; catch the clean stuff.
• 90–100%: only A-setups; patient mode.
• Watch the ribbon: When shorter candidates heat up before a cross, momentum is forming. If long candidates dominate, you’re in a slower trend cycle.
⸻
Non-repainting & safety notes
• All request.security() calls use lookahead=barmerge.lookahead_off, gaps=barmerge.gaps_on.
• No forward references; decisions rely on confirmed bar data.
• EMA lengths are simple ints (no series-length errors).
• Confidence components are computed every bar (no conditional ta.* traps).
⸻
Limitations & tips
• Chop happens: ER helps, but sideways microstructure can still flicker—use Confidence + Vol filter as brakes.
• Presets ≠ oracle: They’re sensible baselines; always tune MinConf and Min ATR% to your venue and session.
• Theme “Auto”: Pine cannot read chart theme; “Auto” defaults to a Dark-friendly palette.
⸻
Publisher’s Screenshots Checklist
1) FX swing — EURUSD 1H
• Preset: FX 1H (Conservative)
• Params: MinConf=70, ATR Len=14, Min ATR%=0.12, MTF ON (TF=4H, 20/50)
• Show: Clear BUY cross, STATUS=OK, green regime background; Fitness Ribbon visible.
2) FX intraday — GBPUSD 15m
• Preset: FX 15m (Active)
• Params: MinConf=60, ATR Len=14, Min ATR%=0.20, MTF ON (TF=60m)
• Show: SELL cross near London session open. HTF lines enabled (translucent).
• Caption: “GBPUSD 15m • Active session sell with MTF alignment.”
3) Indices — SPY 1D
• Preset: Equities 1D
• Params: MinConf=60, ATR Len=14, Min ATR%=0.08, MTF ON (TF=1W, 20/50)
• Show: Longer trend run after BUY cross; regime shading shows persistence.
• Caption: “SPY 1D • Trend run after BUY cross; weekly filter aligned.”
4) Crypto — BINANCE:BTCUSDT 1H
• Preset: Crypto 1H
• Params: MinConf=75, ATR Len=14, Min ATR%=0.25, MTF ON (TF=4H)
• Show: BUY cross + quick follow-through; Ribbon warming (reds/yellows → greens).
• Caption: “BTCUSDT 1H • Momentum break with high confidence and ribbon turning.”

AI Agent XAU Scalper V1AI Agent XAU Scalper V1 is a custom indicator designed to help traders read the XAU/USD (Gold) market direction more quickly and clearly, especially on lower timeframes (M1–M15).
This indicator provides automatic BUY/SELL signals along with a dynamic trail line that can be used as a guide for moving support and resistance levels. With a clean and informative display, it is suitable for day traders who need fast decision-making in the highly volatile gold market.
🎯 Key Features
Automatic BUY/SELL signals with clear and easy-to-read labels.
Dynamic trail line as a guide for support and resistance.
Optional Heikin Ashi mode for smoother trend visualization.
Alert system → supports TradingView notifications so traders never miss an entry.
Optimized for XAU/USD scalping → works best on M1, M5, and M15 timeframes.
⚡ How to Use
Add the indicator to the XAU/USD chart.
Adjust the parameters as needed:
ATR Period (default 10)
Sensitivity (default 1.0)
Heikin Ashi mode: optional
Follow the signals:
Green label = BUY
Red label = SELL
Trail line = dynamic support/resistance guide
📌 Notes
This indicator is not a guaranteed profit tool. Always apply proper risk management and trading discipline.
Recommended for scalping on lower timeframes, but can also be tested on higher timeframes depending on the trader’s style.

Gap Zones Pro - Price Action Confluence Indicator with Alerts█ OVERVIEW
Gap Zones Pro identifies and tracks price gaps - crucial areas where institutional interest and market imbalance create high-probability reaction zones. These gaps represent areas of strong initial buying/selling pressure that often act as magnets when price returns.
█ WHY GAPS MATTER IN TRADING
- Gaps reveal institutional footprints and areas of market imbalance
- When price returns to a gap, it often reaffirms the original directional bias
- Failed gap reactions can signal powerful reversals in the opposite direction
- Gaps provide excellent confluence when aligned with your trading narrative
- They act as natural support/resistance zones with clear risk/reward levels
█ KEY FEATURES
- Automatically detects and visualizes all gap zones on your chart
- Extends gaps to the right edge for easy monitoring
- Customizable number of gaps displayed (manage chart clarity)
- Minimum gap size filter to focus on significant gaps only
- Real-time alerts when price enters gap zones
- Color-coded visualization (green for gap ups, red for gap downs)
- Clean, professional appearance with adjustable transparency
█ HOW TO USE
1. Add to chart and adjust maximum gaps displayed based on your timeframe
2. Set minimum gap size % to filter out noise (0.5-1% recommended for stocks)
3. Watch for price approaching gap zones for potential reactions
4. Use gaps as confluence with other technical factors:
- Support/resistance levels
- Fibonacci retracements
- Supply/demand zones
- Trend lines and channels
5. Set alerts to notify you when price enters key gap zones
█ TRADING TIPS
- Gaps with strong contextual stories (earnings, news, breakouts) are most reliable
- Multiple gaps in the same area create stronger zones
- Unfilled gaps above price can act as resistance targets
- Unfilled gaps below price can act as support targets
- Watch for "gap and go" vs "gap fill" scenarios based on market context
█ SETTINGS
- Maximum Number of Gaps: Control how many historical gaps to display
- Minimum Gap Size %: Filter out insignificant gaps
- Colors: Customize gap up and gap down zone colors
- Transparency: Adjust visibility while maintaining chart readability
- Show Borders: Toggle gap zone borders on/off
- Alerts: Automatic notifications when price crosses gap boundaries
█ BEST TIMEFRAMES
Works on all timeframes but most effective on:
- Daily charts for swing trading
- 4H for intraday position trading
- 1H for day trading key levels
- Weekly for long-term investing
Remember: Gaps are most powerful when they align with your overall market thesis and other technical confluences. They should confirm your narrative, not define it.
---
Updates: Real-time gap detection | Alert system | Extended visualization | Performance optimized

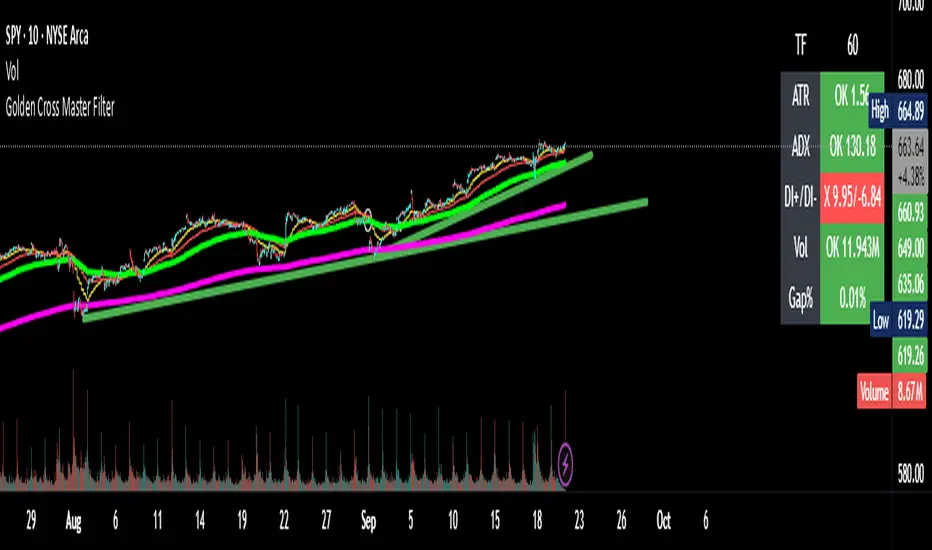
Golden Cross Master Filter by Carlos ChavezForget noisy Golden/Death Cross signals.
This is the **Golden Cross Master Filter** – built for traders who demand institutional-level confirmation.
✅ Exact EMA cross points with circle markers
✅ ATR / ADX / DI+ / DI- / Volume filters
✅ Gap% detection
✅ Visual OK/X dashboard
✅ Instant BUY/SELL labels & ready-to-use alerts
Cut the noise. Trade only the strongest crosses. 🚀
Golden Cross Master Filter is a professional tool to detect Golden and Death Crosses with institutional-grade filtering.
🚀 Features:
- ✅ ATR / ADX / DI+/DI- / Volume conditions
- ✅ Gap% detection (daily gap between yesterday’s close and today’s open)
- ✅ Visual dashboard with OK/X status
- ✅ Exact circle markers at EMA cross points
- ✅ Ready-to-use BUY/SELL labels when filters are confirmed
- ✅ Built-in alerts for easy automation
This indicator is designed for intraday and swing traders who rely on EMA crosses but want to eliminate false signals.
It works across multiple timeframes (10m, 1h, 4h, Daily) and adapts to different trading styles.
Whether you trade CALLs/PUTs or just want stronger confirmation for Golden/Death Crosses, this filter helps you focus only on high-probability setups.
ORB + Session VWAP Pro (London & NY) — fixedORB + Session VWAP Pro (London & NY) — Listing copy (EN)
What it is
A clean, non-repainting intraday tool that fuses the classic Opening Range Breakout (ORB) with a session-anchored VWAP filter for London and New York. It highlights only the higher-quality breakouts (above/below session VWAP), adds an optional retest confirmation, and scores each signal with an intuitive Confidence metric (0–100).
Why it works
• ORB provides the day’s first actionable structure (range high/low).
• Session VWAP filters “cheap” breaks and favors flows aligned with session value.
• Optional retest reduces first-tick whipsaws.
• Confidence blends breakout depth (vs ATR), VWAP slope and band distance.
Key visuals
• LDN/NY OR High/Low (line break style) + optional OR boxes.
• Active Session VWAP (resets per signal window; falls back to daily VWAP outside).
• Optional VWAP bands (stdev or %).
• Session shading (London/NY windows).
• Signal markers (LDN BUY/SELL, NY BUY/SELL) fired with cooldown.
Signals
• London Long / Short: Break of LDN OR High/Low ± ATR buffer, aligned with VWAP side.
• NY Long / Short: Same logic during NY window.
• Retest (optional): Requires a tag back to the OR level ± tolerance before confirmation.
• Confidence: 0–100; gate via Min Confidence (default 55).
Inputs that matter
• Open Range Length (min): Default 15.
• London/NY times & timezones.
• ATR buffer & retest tolerance.
• Bands mode: Stdev (with lookback) or % (e.g., 1%).
• Signal cooldown: Avoids clutter on fast moves.
Non-repaint policy
• OR lines build within fixed time windows using the current bar’s timestamp.
• VWAP is cumulative within the session window; no lookahead.
• All ta.crossover/ta.crossunder are precomputed every bar (no conditional execution).
• Signals are based on live bar values, not future bars.
⸻
Quick start (examples)
1) EURUSD, London momentum
• Chart: 5m or 15m.
• OR: 15 min starting 08:00 Europe/London.
• Signals: Use defaults; keep ATR buffer = 0.2 and Retest = ON, Min Confidence ≥ 55.
• Play:
• BUY when price breaks LDN OR High + buffer and stays above VWAP; retest confirms.
• Trail behind VWAP or band #1; partials into band #2.
2) NAS100, New York breakout & run
• Chart: 5m.
• NY window: 09:30 America/New_York, OR = 15 min.
• Retest OFF on high momentum days; Min Confidence ≥ 60.
• Use band mode Stdev, bandLen=50, show ±1/±2.
• Momentum continuation: add on pullbacks that hold above VWAP after the breakout.
3) XAUUSD, London fake & VWAP fade
• Chart: 5m.
• Keep Retest ON; accept only shorts that break OR Low but retest fails back under VWAP.
• Confidence gate ≥ 50 to allow more mean-reversion setups.
⸻
Pro tips
• Adjust ATR buffer to the instrument: FX 0.15–0.25, indices 0.20–0.35, metals 0.20–0.30.
• Retest ON for choppy conditions; OFF for news momentum.
• Use VWAP bands: take partials at ±1; stretch targets at ±2/±3.
• Session timezones are explicit (London/New York). Ensure they match your instrument’s behavior.
• Pair with a higher-TF bias (e.g., 1H/4H trend) for directional filtering.
⸻
Alerts (ready to use)
• ORB+SVWAP — LDN Long, LDN Short, NY Long, NY Short
(Respect your cooldown; alerts fire only after confirmation and confidence gate.)
⸻
Known limits & notes
• Designed for intraday. On 1D+ charts, session windows compress.
• If your broker session differs from London/NY clocks on a holiday, adjust input times.
• Session-anchored VWAP uses the script’s signal window, not exchange sessions, by design.

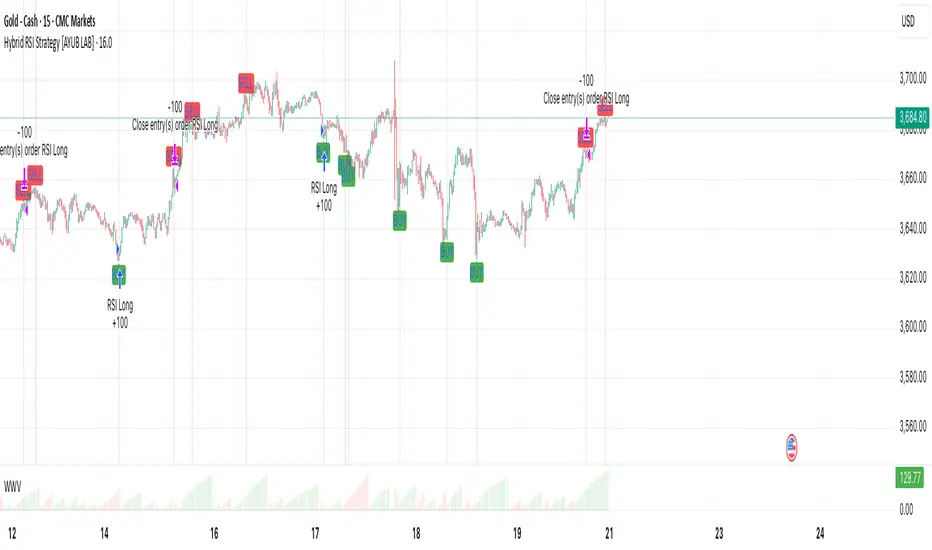
Hybrid RSI Strategy [Heifereum ]This is a hybrid script that combines visual RSI indicator signals with an optional backtestable trading strategy.
BUY Entry: When RSI crosses above the oversold level (default 30)
SELL Exit: When RSI crosses below the overbought level (default 70)
Timeframe: Works best on trending assets (crypto, forex, indices) in 5min to 1H
Backtest Toggle: Turn ON/OFF live testing using the Enable Backtest Mode? setting
Visual Cues: Buy/Sell labels, background coloring, and alerts ready for webhook automation
Use this strategy to visually explore RSI dynamics, run performance backtests, or hook up to external bots via alerts.
EMA50 + SR Boxes + VP Right + ATR + SL% + Entries + SentimentThis indicator combines several pro-grade building blocks to read the market at a glance:
EMA50 as a trend filter.
Smart Support/Resistance zones (rectangles) detected where price has touched multiple times.
“U / Inverted U” markers (confirmed pivots).
Optional Buy/Sell signals: only when a U appears inside a support zone with price above the EMA50 (buy), or an inverted U inside a resistance zone with price below the EMA50 (sell).
Simplified right-side Volume Profile (with a special Forex fallback if volume isn’t usable).
ATR & SL%: displays current ATR and an SL% based on ATR(100) Daily / Close × 100, attached to the latest candle.

Trend Magic EMA RMI Trend Sniper📌 Indicator Name:
Trend Magic + EMA + MA Smoothing + RMI Trend Sniper
📝 Description:
This is a multi-functional trend and momentum indicator that combines four powerful tools into a single overlay:
Trend Magic – Plots a dynamic support/resistance line based on CCI and ATR.
Helps identify trend direction (green = bullish, red = bearish).
Acts as a trailing stop or dynamic level for trade entries/exits.
Exponential Moving Average (EMA) – Smooths price data to highlight the underlying trend.
Customizable length, source, and offset.
Serves as a trend filter or moving support/resistance.
MA Smoothing + Bollinger Bands (Optional) – Adds a secondary smoothing filter based on your choice of SMA, EMA, WMA, VWMA, or SMMA.
Optional Bollinger Bands visualize volatility expansion/contraction.
Great for spotting consolidations and breakout opportunities.
RMI Trend Sniper – A momentum-based system combining RSI and MFI.
Highlights bullish (green) or bearish (red) conditions.
Plots a Range-Weighted Moving Average (RWMA) channel to gauge price positioning.
Provides visual BUY/SELL labels and optional bar coloring for fast decision-making.
📊 Uses & Trading Applications:
✅ Trend Identification: Spot the dominant market direction quickly with Trend Magic & EMA.
✅ Momentum Confirmation: RMI Sniper helps confirm whether the market has strong bullish or bearish pressure.
✅ Dynamic Support/Resistance: Trend Magic & EMA act as adaptive levels for stop-loss or trailing positions.
✅ Volatility Analysis: Optional Bollinger Bands show squeezes and potential breakout setups.
✅ Entry/Exit Signals: BUY/SELL alerts and color-coded candles make spotting trade opportunities simple.
💡 Best Use Cases:
Swing Trading: Follow Trend Magic + EMA alignment for higher probability trades.
Scalping/Intraday: Use RMI signals with bar coloring for quick momentum entries.
Trend Following Strategies: Ride trends until Trend Magic flips direction.
Breakout Trading: Watch for price closing outside the Bollinger Bands with RMI confirmation.

Supertrend DashboardOverview
This dashboard is a multi-timeframe technical indicator dashboard based on Supertrend. It combines:
Trend detection via Supertrend
Momentum via RSI and OBV (volume)
Volatility via a basic candle-based metric (bs)
Trend strength via ADX
Multi-timeframe analysis to see whether the trend is bullish across different timeframes
It then displays this info in a table on the chart with colors for quick visual interpretation.
2️⃣ Inputs
Dashboard settings:
enableDashboard: Toggle the dashboard on/off
locationDashboard: Where the table appears (Top right, Bottom left, etc.)
sizeDashboard: Text size in the table
strategyName: Custom name for the strategy
Indicator settings:
factor (Supertrend factor): Controls how far the Supertrend lines are from price
atrLength: ATR period for Supertrend calculation
rsiLength: Period for RSI calculation
Visual settings:
colorBackground, colorFrame, colorBorder: Control dashboard style
3️⃣ Core Calculations
a) Supertrend
Supertrend is a trend-following indicator that generates bullish or bearish signals.
Logic:
Compute ATR (atr = ta.atr(atrLength))
Compute preliminary bands:
upperBand = src + factor * atr
lowerBand = src - factor * atr
Smooth bands to avoid false flips:
lowerBand := lowerBand > prevLower or close < prevLower ? lowerBand : prevLower
upperBand := upperBand < prevUpper or close > prevUpper ? upperBand : prevUpper
Determine direction (bullish / bearish):
dir = 1 → bullish
dir = -1 → bearish
Supertrend line = lowerBand if bullish, upperBand if bearish
Output:
st → line to plot
bull → boolean (true = bullish)
b) Buy / Sell Trigger
Logic:
bull = ta.crossover(close, supertrend) → close crosses above Supertrend → buy signal
bear = ta.crossunder(close, supertrend) → close crosses below Supertrend → sell signal
trigger → checks which signal was most recent:
trigger = ta.barssince(bull) < ta.barssince(bear) ? 1 : 0
1 → Buy
0 → Sell
c) RSI (Momentum)
rsi = ta.rsi(close, rsiLength)
Logic:
RSI > 50 → bullish
RSI < 50 → bearish
d) OBV / Volume Trend (vosc)
OBV tracks whether volume is pushing price up or down.
Manual calculation (safe for all Pine versions):
obv = ta.cum( math.sign( nz(ta.change(close), 0) ) * volume )
vosc = obv - ta.ema(obv, 20)
Logic:
vosc > 0 → bullish
vosc < 0 → bearish
e) Volatility (bs)
Measures how “volatile” the current candle is:
bs = ta.ema(math.abs((open - close) / math.max(high - low, syminfo.mintick) * 100), 3)
Higher % → stronger candle moves
Displayed on dashboard as a number
f) ADX (Trend Strength)
= ta.dmi(14, 14)
Logic:
adx > 20 → Trending
adx < 20 → Ranging
g) Multi-Timeframe Supertrend
Timeframes: 1m, 3m, 5m, 10m, 15m, 30m, 1H, 2H, 4H, 12H, 1D
Logic:
for tf in timeframes
= request.security(syminfo.tickerid, tf, f_supertrend(ohlc4, factor, atrLength))
array.push(tf_bulls, bull_tf ? 1.0 : 0.0)
bull_tf ? 1.0 : 0.0 → converts boolean to number
Then we calculate user rating:
userRating = (sum of bullish timeframes / total timeframes) * 10
0 → Strong Sell, 10 → Strong Buy
4️⃣ Dashboard Table Layout
Row Column 0 (Label) Column 1 (Value)
0 Strategy strategyName
1 Technical Rating textFromRating(userRating) (color-coded)
2 Current Signal Buy / Sell (based on last Supertrend crossover)
3 Current Trend Bullish / Bearish (based on Supertrend)
4 Trend Strength bs %
5 Volume vosc → Bullish/Bearish
6 Volatility adx → Trending/Ranging
7 Momentum RSI → Bullish/Bearish
8 Timeframe Trends 📶 Merged cell
9-19 1m → Daily Bullish/Bearish for each timeframe (green/red)
5️⃣ Color Logic
Green shades → bullish / trending / buy
Red / orange → bearish / weak / sell
Yellow → neutral / ranging
Example:
dashboard_cell_bg(1, 1, colorFromRating(userRating))
dashboard_cell_bg(1, 2, trigger ? color.green : color.red)
dashboard_cell_bg(1, 3, superBull ? color.green : color.red)
Makes the dashboard visually intuitive
6️⃣ Key Logic Flow
Calculate Supertrend on current timeframe
Detect buy/sell triggers based on crossover
Calculate RSI, OBV, Volatility, ADX
Request Supertrend on multiple timeframes → convert to 1/0
Compute user rating (percentage of bullish timeframes)
Populate dashboard table with colors and values
✅ The result: You get a compact, fast, multi-timeframe trend dashboard that shows:
Current signal (Buy/Sell)
Current trend (Bullish/Bearish)
Momentum, volatility, and volume cues
Trend across multiple timeframes
Overall technical rating
It’s essentially a full trend-strength scanner directly on your chart.

MACD Scaled Overlay█ OVERVIEW
The "MACD Scaled Overlay" indicator is an advanced version of the classic MACD (Moving Average Convergence Divergence) oscillator that displays signals directly on the price chart. Instead of a traditional separate panel, the MACD line, signal line, and histogram are scaled and overlaid on the price chart, making it easier to identify key price levels and potential reversal points. The indicator also supports the detection of divergences (regular and hidden) and offers extensive customization options, such as adjusting colors, line thickness, and enabling/disabling visual elements.
█ CONCEPTS
The "MACD Scaled Overlay" indicator is designed to simplify trend and reversal analysis by integrating MACD signals with the price chart. The MACD Scaled Overlay is scaled relative to the average candle range, allowing the lines and histogram to dynamically adjust to market volatility. Additionally, the indicator enables the detection of divergences (bullish and bearish, both regular and hidden) based on the traditional MACD histogram (before scaling), ensuring consistency with classic divergence analysis. The indicator is most effective when combined with other technical analysis tools, such as Fibonacci levels, pivot points, or trend lines.
█ MACD Calculations and Scaling
The indicator is based on the classic MACD formula, which includes:
-MACD Line: The difference between the fast EMA (default: 12) and the slow EMA (default: 26).
-Signal Line: The EMA of the MACD line (default: 9).
-Histogram: The difference between the MACD line and the signal line.
Scaling is achieved by normalizing the MACD values relative to the standard deviation and the average candle range. This makes the lines and histogram dynamically adjust to market volatility, improving their readability and utility on the price chart. The scaling formulas are:
-MACD Scaled: macdNorm * avgRangeLines * scaleFactor
-Signal Scaled: signalNorm * avgRangeLines * scaleFactor
-Histogram Scaled: histNorm * avgRangeHist * scaleFactor
Where:
-macdNorm and signalNorm are the normalized MACD and signal line values.
-avgRangeLines and avgRangeHist are the average candle ranges.
-scaleFactor is the scaling multiplier (default: 2).
The positioning of the lines and histogram is relative to the candle midpoint (candleMid = (high + low) / 2), ensuring proper display on the price chart. Divergences are calculated based on the traditional MACD histogram (before scaling), maintaining consistency with standard divergence detection methodology.
█INDICATOR FEATURES
-Dynamic MACD and Signal Lines: Scaled and overlaid on the price chart, facilitating the identification of reversal points.
-Histogram: Displays the difference between the MACD and signal lines, dynamically adjusted to market volatility.
-Divergence Detection: Ability to detect regular and hidden divergences (bullish and bearish) based on the traditional MACD histogram, with options to enable/disable their display.
-Visual Customization: Options to adjust colors, line thickness, transparency, and enable/disable elements such as the zero line, MACD line, signal line, or histogram.
-Smoothing: Smoothing length for lines (default: 1) and histogram (default: 3). Smoothing may delay crossover signals, which should be considered during analysis.
-Alerts: Alert conditions for MACD and signal line crossovers, enabling notifications for potential buy/sell signals.
█ HOW TO SET UP THE INDICATOR
-Add the "MACD Scaled Overlay" indicator to your TradingView chart.
-Configure parameters in the settings, such as EMA lengths, scaling multiplier, or smoothing periods, to match your trading style.
-Enable or disable the display of the zero line, MACD line, signal line, or histogram based on your needs.
-Adjust colors and line thickness in the "Style" section and transparency settings in the input section to optimize visualization.
█ HOW TO USE
Add the indicator to your chart, configure the parameters, and observe the interactions of the price with the MACD line, signal line, and histogram to identify potential entry and exit points. Key signals include:
-MACD and Signal Line Crossovers: A crossover of the MACD line above the signal line may indicate a buy signal (bullish cross), while a crossover below the signal line may indicate a sell signal (bearish cross).
-Crossings Through the Price Line (Zero): The MACD line or histogram crossing the price line (candle midpoint) may indicate a change in momentum. For example, the histogram moving from negative to positive values near the price line may signal increasing bullish trend strength.
-Divergences: Detection of regular and hidden divergences (bullish and bearish) based on the traditional MACD histogram can help predict trend reversals. Divergences are not standalone signals, as they are delayed by the specified pivot length (default: 3). However, they help strengthen the significance of other signals, such as crossovers or support/resistance levels.
The indicator is most effective when combined with other tools, such as Fibonacci levels, pivot points, or support/resistance lines, to confirm signals.

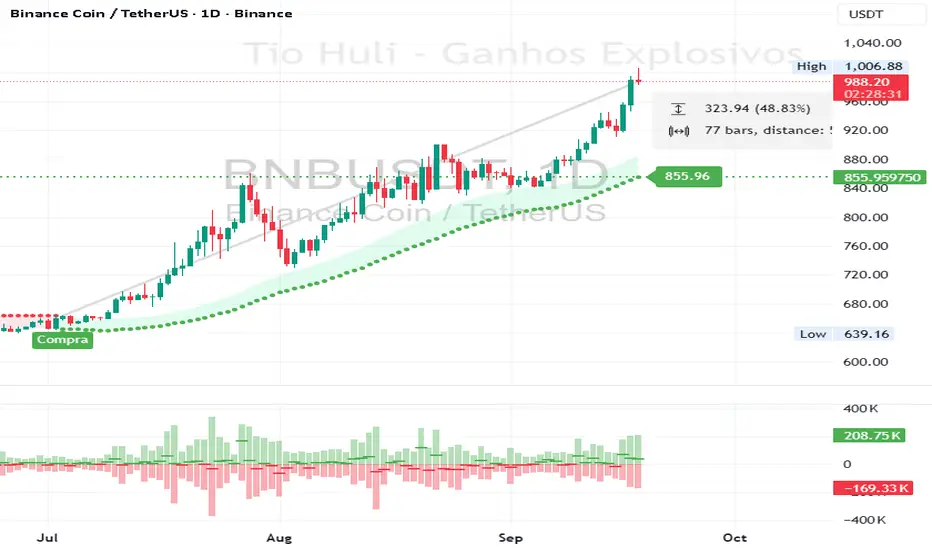
CHiLo — Custom HiLo (SMA/EMA, Activator, Shading, Auto-Decimals)CHiLo is a clean Hi/Lo trend read with SMA/EMA options, a HiLo vs. HiLo Activator mode, optional band shading , and a right-side HiLo marker with automatic decimals based on the symbol. Optional Buy/Sell labels mark state flips. Inspired by the broader trend-following literature and practitioners; in Brazil, educator Hulisses “Tio Huli” Dias is a notable voice popularizing trend following.
What it does
CHiLo plots a Hi/Lo state with two modes:
HiLo (classic high/low bands)
HiLo Activator (activator-style behavior)
It includes:
SMA/EMA selection
Optional shading between Hi/Lo bands
Optional Buy/Sell labels on state flips
HiLo marker (auto-decimals from the symbol’s tick size)
Goal: deliver a fast, visual trend context that you can pair with your own risk rules and confirmations.
How to use
Add the indicator and choose Mode (HiLo / Activator) and MA type (SMA/EMA).
Tune Period (and Offset if needed). Higher = smoother (fewer flips); lower = more responsive.
Toggle Shading to emphasize the envelope.
Toggle Buy/Sell labels if you want flip markers.
Use the HiLo marker on the right to read the current level (auto-formatted).
Inputs (quick reference)
Period / Offset — sensitivity vs. delay.
Type — HiLo or HiLo Activator.
MA Type — SMA (steadier) or EMA (snappier).
HiLo Style — Points or Line.
Shading & Transparency — highlight the band area.
Buy/Sell Labels — on/off.
HiLo Marker — size and horizontal offset (decimals automatic).
Notes & credits
Educational use only; not financial advice.
For best results, combine with position sizing, stops, and regime filters.
Ultimate Sniper Entry - Pivot PerfectionT2R📌 Description
The Ultimate Sniper Entry – Pivot Perfection is a precision trading tool designed to identify high-probability pivot points and generate early buy/sell entries with strong confirmation. By combining pivot detection, volume spikes, momentum filters (RSI), candle patterns, and EMA trend alignment, this system helps traders capture market reversals and trend continuation setups with improved accuracy.
It offers:
Smart Pivot Detection with adjustable sensitivity.
Multi-layer Confirmation: volume, momentum, candle structure, and EMA trend filter.
Non-Repainting Signals: arrows plotted only after pivot confirmation.
Visual Aids: buy/sell arrows, optional pivot markers, background trend shading.
Alerts: instant notifications for sniper buy/sell entries.
Info Panel: quick reference guide directly on chart.
Ideal for traders who want structured, rules-based entries while avoiding false signals, the Ultimate Sniper Entry system adapts to multiple markets and timeframes.

Pullback & ATR Trailing Strategy※日本語は英文の次に記載あります。
Overview
This indicator combines short-term RSI pullback/rebound signals with long-term RSI divergence to visualize potential buy and sell opportunities.
It also plots ATR-based trailing stops and partial take-profit lines, making it suitable for day trading and short-term trading.
Alerts are triggered when signal conditions are met.
Key Features
Detect short-term RSI pullbacks/rebounds (default 6 periods)
Detect divergences on long-term RSI
Visualize buy/sell signals with labels
Display ATR-based trailing stop and partial take-profit lines
Trigger alerts when conditions are met
Settings Explanation
Short-term RSI Length (rsiShortLen) Period for short-term RSI used to detect pullbacks or rebounds
Pullback Threshold (levelLow) RSI level below which a buy signal is considered
Rebound Threshold (levelHigh) RSI level above which a sell signal is considered
Long-term Timeframe (longTF) Timeframe used for divergence detection
Long-term RSI Length (longRSILen) Period for RSI on the long-term timeframe, used for divergence detection
Pivot Width Left / Right (pivotLeft / pivotRight)
Determines how we detect swing highs/lows (peaks and valleys).
For example, with pivotLeft=3 and pivotRight=3, a bar is considered a swing high if it is higher than the 3 bars to its left and 3 bars to its right.
Larger numbers detect only bigger swings, smaller numbers also detect smaller swings.
ATR Length (atrLen) Period for ATR calculation for trailing stops
ATR Multiplier (atrMult) Multiplier for ATR to calculate trailing stop distance
Partial Take-Profit Multiplier (tpMult) Multiplier to calculate half-profit level based on swing amplitude
Green line (Long Trail / translucent green)
ATR-based trailing stop line for long positions.
Used as a stop-loss or trailing stop for open buy trades.
Dark green line shows partial take-profit (TP), translucent green shows trailing stop level.
Red line (Short Trail / translucent red)
ATR-based trailing stop line for short positions.
Used as a stop-loss or trailing stop for open sell trades.
Dark red line shows partial take-profit (TP), translucent red shows trailing stop level.
Note: TP lines indicate partial take-profit targets, while ATR trailing lines indicate stop-loss/trailing stop levels if the price moves against the position.
日本語説明ーーーーーーーーーーーーーーーーーーーーーーーーーーーー
概要
このインジケーターは、短期RSIの押し目/戻りシグナルと、長期足RSIによるダイバージェンスを組み合わせて、買い・売りのチャンスを可視化します。
さらに、ATRベースのトレールストップラインや半分利確ラインも表示し、デイトレードや短期トレードに最適化しています。
シグナル条件に一致した場合にアラートも作動します。
主な機能
短期RSI(デフォルト6期間)で押し目・戻りを検出
長期足RSIでのダイバージェンスを検出
BUY/SELLラベルでシグナルを視覚化
ATRベースのトレールライン・半分利確ラインを表示
条件一致時にアラート発動
各設定の説明
短期RSI期間 (rsiShortLen) デイトレ用の短期RSIの期間。押し目や戻りのシグナルに使用
押し目閾値 (levelLow) RSIが下回ったら買いシグナル判定に使用
戻り閾値 (levelHigh) RSIが上回ったら売りシグナル判定に使用
長期足 (longTF) ダイバージェンス判定用の長期足の時間軸
長期RSI期間 (longRSILen) 長期足で計算するRSIの期間。ダイバージェンス判定に使用
左右ピボット幅 (pivotLeft / pivotRight) 高値や安値を「スイングの山・谷」として判定する時に使う幅です。
例えば pivotLeft=3, pivotRight=3 の場合、「左に3本、右に3本のローソク足より高い/低い点」をスイングの頂点や底と見なします。
数値を大きくすると大きな波だけを拾い、小さくすると小さな波も拾いやすくなります。
ATR期間 (atrLen) トレールライン計算用ATRの期間
ATR倍率 (atrMult) トレールラインの距離をATRに掛ける倍率
半分利確倍率 (tpMult) 押し目/戻り幅に対して半分利確ラインを設定する倍率
緑の線(Long Trail / 半透明緑)
ATRベースのトレールストップラインです。
買いポジション中の損切り目安やトレーリングストップとして使います。
緑の濃い線は半分利確ライン(TP)、薄い緑の線はトレールストップの位置を示します。
赤い線(Short Trail / 半透明赤)
ATRベースのトレールストップラインです。
売りポジション中の損切り目安やトレーリングストップとして使います。
赤の濃い線は半分利確ライン(TP)、薄い赤の線はトレールストップの位置を示します。
補足:TP(Take Profit)線は半分利確の目安で、ATRトレールラインはポジションが逆行した時の損切り目安です。

Structural Liquidity Signals [BullByte]Structural Liquidity Signals (SFP, FVG, BOS, AVWAP)
Short description
Detects liquidity sweeps (SFPs) at pivots and PD/W levels, highlights the latest FVG, tracks AVWAP stretch, arms percentile extremes, and triggers after confirmed micro BOS.
Full description
What this tool does
Structural Liquidity Signals shows where price likely tapped liquidity (stop clusters), then waits for structure to actually change before it prints a trigger. It spots:
Liquidity sweeps (SFPs) at recent pivots and at prior day/week highs/lows.
The latest Fair Value Gap (FVG) that often “pulls” price or serves as a reaction zone.
How far price is stretched from two VWAP anchors (one from the latest impulse, one from today’s session), scaled by ATR so it adapts to volatility.
A “percentile” extreme of an internal score. At extremes the script “arms” a setup; it only triggers after a small break of structure (BOS) on a closed bar.
Originality and design rationale, why it’s not “just a mashup”
This is not a mashup for its own sake. It’s a purpose-built flow that links where liquidity is likely to rest with how structure actually changes:
- Liquidity location: We focus on areas where stops commonly cluster—recent pivots and prior day/week highs/lows—then detect sweeps (SFPs) when price wicks beyond and closes back inside.
- Displacement context: We track the last Fair Value Gap (FVG) to account for recent inefficiency that often acts as a magnet or reaction zone.
- Stretch measurement: We anchor VWAP to the latest N-bar impulse and to the Daily session, then normalize stretch by ATR to assess dislocation consistently across assets/timeframes.
- Composite exhaustion: We combine stretch, wick skew, and volume surprise, then bend the result with a tanh transform so extremes are bounded and comparable.
- Dynamic extremes and discipline: Rather than triggering on every sweep, we “arm” at statistical extremes via percent-rank and only fire after a confirmed micro Break of Structure (BOS). This separates “interesting” from “actionable.”
Key concepts
SFP (liquidity sweep): A candle briefly trades beyond a level (where stops sit) and closes back inside. We detect these at:
Pivots (recent swing highs/lows confirmed by “left/right” bars).
Prior Day/Week High/Low (PDH/PDL/PWH/PWL).
FVG (Fair Value Gap): A small 3‑bar gap (bar2 high vs bar1 low, or vice versa). The latest gap often acts like a magnet or reaction zone. We track the most recent Up/Down gap and whether price is inside it.
AVWAP stretch: Distance from an Anchored VWAP divided by ATR (volatility). We use:
Impulse AVWAP: resets on each new N‑bar high/low.
Daily AVWAP: resets each new session.
PR (Percentile Rank): Where the current internal score sits versus its own recent history (0..100). We arm shorts at high PR, longs at low PR.
Micro BOS: A small break of the recent high (for longs) or low (for shorts). This is the “go/no‑go” confirmation.
How the parts work together
Find likely liquidity grabs (SFPs) at pivots and PD/W levels.
Add context from the latest FVG and AVWAP stretch (how far price is from “fair”).
Build a bounded score (so different markets/timeframes are comparable) and compute its percentile (PR).
Arm at extremes (high PR → short candidate; low PR → long candidate).
Only print a trigger after a micro BOS, on a closed bar, with spacing/cooldown rules.
What you see on the chart (legend)
Lines:
Teal line = Impulse AVWAP (resets on new N‑bar extreme).
Aqua line = Daily AVWAP (resets each session).
PDH/PDL/PWH/PWL = prior day/week levels (toggle on/off).
Zones:
Greenish box = latest Up FVG; Reddish box = latest Down FVG.
The shading/border changes after price trades back through it.
SFP labels:
SFP‑P = SFP at Pivot (dotted line marks that pivot’s price).
SFP‑L = SFP at Level (at PDH/PDL/PWH/PWL).
Throttle: To reduce clutter, SFPs are rate‑limited per direction.
Triggers:
Triangle up = long trigger after BOS; triangle down = short trigger after BOS.
Optional badge shows direction and PR at the moment of trigger.
Optional Trigger Zone is an ATR‑sized box around the trigger bar’s close (for visualization only).
Background:
Light green/red shading = a long/short setup is “armed” (not a trigger).
Dashboard (Mini/Pro) — what each item means
PR: Percentile of the internal score (0..100). Near 0 = bullish extreme, near 100 = bearish extreme.
Gauge: Text bar that mirrors PR.
State: Idle, Armed Long (with a countdown), or Armed Short.
Cooldown: Bars remaining before a new setup can arm after a trigger.
Bars Since / Last Px: How long since last trigger and its price.
FVG: Whether price is in the latest Up/Down FVG.
Imp/Day VWAP Dist, PD Dist(ATR): Distance from those references in ATR units.
ATR% (Gate), Trend(HTF): Status of optional regime filters (volatility/trend).
How to use it (step‑by‑step)
Keep the Safety toggles ON (default): triggers/visuals on bar‑close, optional confirmed HTF for trend slope.
Choose timeframe:
Intraday (5m–1h) or Swing (1h–4h). On very fast/thin charts, enable Performance mode and raise spacing/cooldown.
Watch the dashboard:
When PR reaches an extreme and an SFP context is present, the background shades (armed).
Wait for the trigger triangle:
It prints only after a micro BOS on a closed bar and after spacing/cooldown checks.
Use the Trigger Zone box as a visual reference only:
This script never tells you to buy/sell. Apply your own plan for entry, stop, and sizing.
Example:
Bullish: Sweep under PDL (SFP‑L) and reclaim; PR in lower tail arms long; BOS up confirms → long trigger on bar close (ATR-sized trigger zone shown).
Bearish: Sweep above PDH/pivot (SFP‑L/P) and reject; PR in upper tail arms short; BOS down confirms → short trigger on bar close (ATR-sized trigger zone shown).
Settings guide (with “when to adjust”)
Safety & Stability (defaults ON)
Confirm triggers at bar close, Draw visuals at bar close: Keep ON for clean, stable prints.
Use confirmed HTF values: Applies to HTF trend slope only; keeps it from changing until the HTF bar closes.
Performance mode: Turn ON if your chart is busy or laggy.
Core & Context
ATR Length: Bigger = smoother distances; smaller = more reactive.
Impulse AVWAP Anchor: Larger = fewer resets; smaller = resets more often.
Show Daily AVWAP: ON if you want session context.
Use last FVG in logic: ON to include FVG context in arming/score.
Show PDH/PDL/PWH/PWL: ON to see prior day/week levels that often attract sweeps.
Liquidity & Microstructure
Pivot Left/Right: Higher values = stronger/rarer pivots.
Min Wick Ratio (0..1): Higher = only more pronounced SFP wicks qualify.
BOS length: Larger = stricter BOS; smaller = quicker confirmations.
Signal persistence: Keeps SFP context alive for a few bars to avoid flicker.
Signal Gating
Percent‑Rank Lookback: Larger = more stable extremes; smaller = more reactive extremes.
Arm thresholds (qHi/qLo): Move closer to 0.5 to see more arms; move toward 0/1 to see fewer arms.
TTL, Cooldown, Min bars and Min ATR distance: Space out triggers so you’re not reacting to minor noise.
Regime Filters (optional)
ATR percentile gate: Only allow triggers when volatility is at/above a set percentile.
HTF trend gate: Only allow longs when the HTF slope is up (and shorts when it’s down), above a minimum slope.
Visuals & UX
Only show “important” SFPs: Filters pivot SFPs by Volume Z and |Impulse stretch|.
Trigger badges/history and Max badge count: Control label clutter.
Compact labels: Toggle SFP‑P/L vs full names.
Dashboard mode and position; Dark theme.
Reading PR (the built‑in “oscillator”)
PR ~ 0–10: Potential bullish extreme (long side can arm).
PR ~ 90–100: Potential bearish extreme (short side can arm).
Important: “Armed” ≠ “Enter.” A trigger still needs a micro BOS on a closed bar and spacing/cooldown to pass.
Repainting, confirmations, and HTF notes
By default, prints wait for the bar to close; this reduces repaint‑like effects.
Pivot SFPs only appear after the pivot confirms (after the chosen “right” bars).
PD/W levels come from the prior completed candles and do not change intraday.
If you enable confirmed HTF values, the HTF slope will not change until its higher‑timeframe bar completes (safer but slightly delayed).
Performance tips
If labels/zones clutter or the chart lags:
Turn ON Performance mode.
Hide FVG or the Trigger Zone.
Reduce badge history or turn badge history off.
If price scaling looks compressed:
Keep optional “score”/“PR” plots OFF (they overlay price and can affect scaling).
Alerts (neutral)
Structural Liquidity: LONG TRIGGER
Structural Liquidity: SHORT TRIGGER
These fire when a trigger condition is met on a confirmed bar (with defaults).
Limitations and risk
Not every sweep/extreme reverses; false triggers occur, especially on thin markets and low timeframes.
This indicator does not provide entries, exits, or position sizing—use your own plan and risk control.
Educational/informational only; no financial advice.
License and credits
© BullByte - MPL 2.0. Open‑source for learning and research.
Built from repeated observations of how liquidity runs, imbalance (FVG), and distance from “fair” (AVWAPs) combine, and how a small BOS often marks the moment structure actually shifts.

CCI Stochastic - YOSI
CCI Stochastic (Pro v6) – MTF, Adaptive Bands & Live Label
What it does
This indicator applies a Stochastic calculation on the CCI (K/D lines) to highlight momentum shifts, overbought/oversold zones, and adaptive market regimes. It comes with optional higher-timeframe confirmation, adaptive volatility bands, a live value label, and built-in alerts.
Key Features
Core Signal: Choose between D or K line of the Stoch-CCI.
Extreme Zones: Customizable OB/OS thresholds (default 80/20) and a midline (50), with dynamic background shading.
Adaptive Bands (optional): Mean ± k·standard deviation of the signal, to capture cyclic extremes.
MTF Confirmation (optional): Fetches the same signal from a higher timeframe via request.security.
Arrows/Signals:
Enter – Cross above OS (Buy) / below OB (Sell).
Center – Cross of the 50 midline (momentum shift).
Exit – Exit from extreme zones.
Alerts: All arrow signals + adaptive band crosses.
Live Value Label: Shows the latest signal value near the last bar, customizable decimals/offset/background colors.
Visuals: Red line above OB, green below OS, gray neutral; adaptive band fills.
Use Cases
Momentum / Reversals: Enter with OS/OB crosses confirmed by MTF.
Trend validation: Combine with moving averages (e.g., EMA200) or support/resistance.
Mean Reversion: Fade extreme zones, especially with adaptive band or OB/OS exit alerts.
Inputs
CCI Period, Stoch Period, Smooth K/D – core calculation.
Overbought / Oversold – thresholds (default 80/20).
Line to plot – K or D.
Show Arrows (Enter, Center, Exit) – visual control.
Adaptive Bands – length and k multiplier.
Higher TF – optional confirmation timeframe.
Live Label – decimals, offset, colors.
Quick Tips
For scalping/short-term setups: tighten OB/OS (e.g., 85/15) to filter noise.
In high volatility: increase adaptLen or decrease k to smooth bands.
Reduce false signals: require local + MTF alignment (e.g., only long if MTF > 50).
Disclaimer
This is a technical analysis tool – not a standalone buy/sell signal. Always use with proper risk management, key levels, and confluence from multiple factors.
מה זה עושה?
האינדיקטור מחשב Stochastic על CCI (קו K/D) ומציג אזורי קיצון, חציות ומשטרי שוק. הוא כולל אופציה לאישור מטיימפריים גבוה, בנדים אדפטיביים, תווית ערך חיה והתרעות מוכנות.
יכולות עיקריות
סיגנל מרכזי: בחירה בין קו D או K של Stoch-CCI.
אזורי קיצון: קווים ניתנים להגדרה (ברירת מחדל 80/20) וקו אמצע 50, עם צביעת רקע דינמית כשנכנסים לקיצון.
Adaptive Bands (אופציונלי): ממוצע ± k·סטיית תקן של הסיגנל—מסייע לזהות overheat ומחזוריות.
אישור MTF (אופציונלי): אותו סיגנל מטיימפריים גבוה באמצעות request.security.
חיצים/סיגנלים:
Enter – חציה מלמטה מעל OS (קנייה) / מלמעלה מתחת OB (מכירה).
Center – חציה של 50 (שינוי מומנטום).
Exit – יציאה מאזורים קיצוניים (OS/OB).
Alerts: לכל הסיגנלים לעיל + כניסה/יציאה לבנדים האדפטיביים.
תווית ערך חיה: מציגה את ערך הסיגנל האחרון ליד הנקודה (ספרות ו־offset ניתנים להגדרה).
עיצוב קריא: צבע קו אדום מעל OB, ירוק מתחת OS, אפור ניטרלי; מילוי אזורים.
שימוש מומלץ
מומנטום/היפוכים: כניסה עם חציה מה-OS/OB ואישור מה-MTF.
ממוצע נע/רמות מחיר: חברו לאימות מגמה (למשל EMA200 או תמיכה/התנגדות).
Mean Reversion: חיפוש חזרה מאזורי קיצון, במיוחד כשיש התרעת יציאה מ-OB/OS או נגיעה בבנד אדפטיבי.
קלטים מרכזיים
CCI Period, Stoch Period, Smooth K/D – פרמטרי חישוב.
Overbought / Oversold – ספי קיצון (ברירת מחדל 80/20).
Line to plot – בחירה בין K או D.
Show Arrows/Center/Exit/Enter – שליטה בתצוגת החיצים.
Adaptive Bands (len, k) – חלון ורגישות לבנדים.
Higher TF – טיימפריים לאישור (אופציונלי).
Live Label – ספרות, היסט ברים, צבעי רקע.
טיפים מהירים
בסקלפים/טווחים קצרים: הקשיחו ספי קיצון (למשל 85/15) להפחתת רעש.
בשוק תנודתי: העלו את adaptLen או הורידו את k כדי לקבל בנדים רגישים פחות.
להקטנת אותות שווא: דרשו התאמה בין הסיגנל המקומי ל-MTF (לדוגמה, לונג רק כשה-MTF מעל 50).
הערה חשובה
זהו כלי ניתוח טכני—לא אות קנייה/מכירה בפני עצמו. שלבו אותו עם ניהול סיכונים (SL/TP), בדיקת רמות מפתח ואימות ממספר אינדיקטורים או טיימפריימים.

Grand Slam Risk ManagementGrand Slam Risk Management (GSRM) Indicator
OVERVIEW
The Grand Slam Risk Management Indicator transforms complex position sizing calculations into real-time, visual risk metrics—enabling disciplined trading decisions without the emotional guesswork that destroys accounts. This comprehensive tool is designed for active day traders and swing traders who want to automate critical risk management calculations directly on their TradingView charts. 🚀
THE GRAND SLAM RISK MANAGEMENT STRATEGY
Core Philosophy
The Grand Slam Risk Management Strategy (GSRM) gets its name from baseball's ultimate scoring play: a grand slam can only be hit when three runners are already on base, requiring at least three prior successful at-bats (hits or walks) to create the opportunity. This perfectly embodies the GSRM philosophy—consistent "base hits" in trading create the foundation for larger wins while protecting your account from devastating losses. Just as baseball teams win championships through disciplined, consistent play rather than swinging for the fences every at-bat, successful traders build wealth through reliable, repeatable profits rather than chasing home runs that often result in strikeouts. ⚾
Strategy Framework
Capital Allocation : 💰
• Working Balance: Account balance minus PDT requirement ($25,000 minimum for margin accounts)
• Allocated Buying Power: Working balance × leverage (4:1 for day trading, 2:1 for swing, 1:1 for cash)
• Daily Profit Target: 5% of allocated buying power (default)
The Base Hit System : 🎯
• Daily profit target divided into 4 "base hits"
• Each base hit represents 25% of daily goal
• Max risk per trade: 50% of base hit target (maintains 2:1 reward/risk minimum)
• Daily max loss: 2 base hits (recoverable with 2 winning trades)
Three-Tier Profit Structure : 🚀
• Tier 1 (5%): Minimum acceptable profit - "Why else take the trade?"
• Tier 2 (10%): Solid win - the target "base hit"
• Tier 3 (20%): Home run - when momentum is strongly in your favor 🏠🏃
Position Sizing Levels : 📊
• Quarter Position (25% of max): Testing the waters, lower conviction setups
• Half Position (50% of max): Standard confidence trades
• Max Position (100%): High conviction, ideal setup conditions
INDICATOR FEATURES
Real-Time Calculations ⚡
• Dynamic Position Sizing: Automatically calculates share quantities based on account balance and current price
• Profit & Loss Targets: Displays dollar amounts for profit targets and stop-losses across all position sizes
• Risk Metrics: Shows daily profit goals, max loss thresholds, and P&L ratios
Advanced Stop-Loss Methods 🛡️
1. Percentage-Based Stops : Fixed 50% of profit target (maintains 2:1 reward/risk)
2. ATR-Based Stops : Dynamic stops that adapt to market volatility using Average True Range (ATR)
• Tier 1: 0.5× ATR (tight/scalping)
• Tier 2: 1.0× ATR (standard)
• Tier 3: 1.5× ATR (wide/trending)
Cost Basis Options 📈
• Last Close: Uses previous bar's closing price for stable calculations
• VWMA: Volume-Weighted Moving Average (default: 9) estimate cost-basis from recent volume-weighted price action
• SMA/EMA: Use Simple or Exponential Moving Average (default: 9) useful for planning entries at SMA/EMA cross-overs and bounces.
• VWAP: Volume-Weighted Average Price (default: daily) for entry point planning at bounce or break of VWAP.
* Ask/Bid: Entry point calculations based on current Ask or Bid price (only available on 1T charts)
Visual Risk Management 🔑
• Color-Coded P&L Ratio :
- Green (≤0.5): Conservative, favorable risk ✅
- Yellow (0.5-1.0): Balanced risk ⚠️
- Red (>1.0): Aggressive, requires higher win rate 🛑
• Position Size Color Coding : Green (quarter) → Yellow (half) → Red (max) for quick risk assessment
HOW TO USE THE GSRM INDICATOR
Initial Setup (One-Time Configuration) ⚙️
1. Set Account Balance: Enter your total trading account value
2. Configure PDT Protection: Enable for margin accounts ≥$25,000 to protect required funds
3. Select Leverage: 4:1 (day trading), 2:1 (swing), or 1:1 (cash account)
4. Adjust Risk Percentage: Default 5% of allocated buying power; reduce for conservative approach
Trading Workflow
Pre-Market Preparation: 🌅
1. Review daily profit target and max loss displayed in green/red
2. Note your base hit target - this is your standard trade goal
3. Check P&L ratio - ensure it's sustainable for your win rate
Trade Execution: 🚀
1. Assess Setup Quality :
• Strong setup → Consider half or max position 💪
• Decent setup → Quarter or half position 👍
• Testing idea → Quarter position only 🧪
2. Select Profit Tier Based on Market Conditions :
• Choppy market → Target Tier 1 (5%) 🌊
• Normal conditions → Target Tier 2 (10%) ➡️
• Strong momentum → Target Tier 3 (20%) 🚀
3. Choose Stop Method :
• Percentage stops: Best for stocks with clear support/resistance
• ATR stops: Better for volatile stocks or news-driven trades. WARNING: this may result in tighter stops, negatively affecting your P&L. To offset this effect, try increasing the number of base hits to achieve your daily profit target and recover from a daily max loss. Be sure the resultant P&L ratio is in the conservative range ≤0.5. This will allow you to adjust your per-trade P&L targets without reducing your daily profit target or increasing your max risk.
4. Execute Using Table Values :
• 🔎 Find your position size group (🟢quarter/🟡half/🔴max)
• 🔎 Find your profit target row (5%/10%/20%) for your position size group
• ⚠️ Do not exceed the share count and stop-loss values displayed ⚠️
Risk Management Rules 🛡️
Daily Limits : 🚨
• Stop trading after hitting daily max loss (prevent tilt/revenge trading)
• Stop trading when a low-risk, minimum-loss trade would exceed your daily max loss (prevent exceeding max)
• Stop trading if you fall below the Daily Profit Target after having achieved it (prevent tilt/revenge trading)
• Cold Market: Stop trading after reaching daily profit target (preserve gains) ❄️
• Hot Market: Three Strikes - stop trading after 3 total max loss trades in a day (prevent tilt/revenge trading) 🔥
Position Management : 📏
• Never exceed max position size shown (protects from overleverage)
• Use quarter positions when daily P&L is negative or below first profit goal (40% of target)
• Use half positions only while daily P&L is above first profit goal (40% of target)
• Use full positions only while daily P&L is above profit goal (100% of target)
A/B Testing Features 🧪
Stop-Loss Methods :
• Week 1: Use percentage-based stops
• Week 2: Use ATR-based stops
• Compare win rates and average losses to optimize
Cost Basis Models :
Pick the highest probable cost-basis and keep your entry position below the share count shown to protect from overleveraging your buying power.
⚠️ IMPORTANT: COST BASIS ESTIMATIONS ARE FOR RISK MANAGEMENT CALCULATIONS ONLY - DO NOT USE THIS INFORMATION TO EXECUTE BUY OR SELL ORDERS.
• Fast movers: Use Last Close for stability 🏃or Bid/Ask for real-time price updates (Bid/Ask is only available on 1T charts).
• Liquid stocks: Try VWMA for better entry estimation 💧
• Reversals/Break of VWAP: Use VWAP when anticipating an entry at the Volume-Weighted Average Price 🔄
• Reversals/Break SMA 200: Use SMA when anticipating an entry at the SMA 📉
• Momentum/Trending: Use EMA when anticipating an entry at the EMA bounce 📈
• Price Offset: Plus/Minus $1.00 in $0.10 increments to compensate for slippage, market orders, etc.
Track which method provides better fill estimates. There is no right or wrong choice here because it depends on your style of trading. You can also use the Price Offset option if you find it helps with consistency.
BEST PRACTICES ⭐
1. Start Conservative : Use quarter positions and default settings until familiar with the system 🐣
2. Track Results : Document whether you hit Tier 1, 2, or 3 targets 📝
3. Respect the Math : The calculations assume a 50%+ win rate - if yours is lower, reduce position sizes 🧮
4. Daily Review : Compare actual P&L to base hit targets to calibrate expectations 🔍
5. Adapt to Conditions : Use ATR stops in volatile markets, percentage stops in stable conditions 🌡️
GLOSSARY 📚
• ATR (Average True Range) : A volatility indicator measuring the average range of price movement
• PDT (Pattern Day Trader) : SEC rule requiring $25,000 minimum for accounts making 4+ day trades in 5 business days
• VWAP (Volume-Weighted Average Price) : Average price weighted by volume for the trading session
• VWMA (Volume-Weighted Moving Average) : Moving average that gives more weight to periods with higher volume
• SMA (Simple Moving Average) : Unweighted moving average where each data point is of equal importance
• EMA (Exponential Moving Average) : Moving average that emphasizes the most recent data and information from the market
• P&L : Profit & Loss
IMPORTANT DISCLAIMERS ⚠️
• This indicator and any information provided is for educational and informational purposes only and should not be construed as investment advice, financial advice, trading advice, or any other type of advice. You should not make any investment decision based solely on this indicator.
• All investments and trading involve substantial risk of loss and are not suitable for every investor. You should carefully consider whether trading is suitable for you in light of your experience, objectives, financial resources, and other relevant circumstances. 📉
• Actual trade results may vary from calculated targets due to slippage, market gaps, and execution delays
• The creator of this indicator is not a registered investment advisor, broker-dealer, or financial advisor. Nothing contained herein constitutes a recommendation or solicitation to buy or sell any financial instrument.
• In no event shall the creator be liable for any direct, indirect, incidental, special, or consequential damages arising out of the use of this indicator.
• This indicator DOES NOT calculate support/resistance levels
• This indicator DOES NOT provide buy/sell signals
• This indicator DOES NOT calculate entry prices
• It is the trader's responsibility to determine an appropriate entry price for their chosen strategy
• This indicator provides calculations only - execution discipline remains the trader's responsibility
• Default settings assume PDT margin account rules; adjust for cash accounts
• P&L ratio colors are guidelines - your actual win rate determines sustainable ratios
• Always verify position sizes don't exceed account buying power before executing
SUPPORT AND FEEDBACK 💬
This indicator represents years of trading experience condensed into automated calculations. It's designed to remove emotional decision-making from position sizing while maintaining flexibility for different market conditions and trading styles.
For questions, suggestions, or to share your results using the GSRM strategy, please comment on the TradingView publication page. 🚀
---
Remember: The goal isn't to hit home runs - it's to get on base consistently while avoiding strikeouts. Small wins compound into large gains over time. ⚾💰
Version: 1.0
License: Creative Commons Attribution-NonCommercial-ShareAlike 4.0 International
- creativecommons.org
Compatibility: TradingView Pine Script v6

Iani SMC Sniper XAU v2.2 (Long+Short + News Countdown, v6)Iani SMC Sniper v2.6 — Anytime • Auto Pip • FVG 50% • OB • News Panel
Smart-Money Concepts made simple for intraday XAU/USD (works on any symbol).
Finds BOS, 50% FVG “sniper” entries, optional Order Blocks, London H/L, news countdown, and a mini info panel.
What it does
BOS (Break of Structure): detects bullish/bearish BOS after London sweep logic.
FVG 50% entries: plots precise long/short entry dots at the midpoint of the gap.
Auto TP/SL: TP = RR × risk, SL below/above recent swing with a small buffer.
Order Blocks (optional): marks the last opposite candle after BOS and alerts on OB revisit.
London High/Low: tracks session range; session filter is optional.
News countdown: shows next event time and minutes left (user-selectable timezone).
Mini Panel: top-left table with Trend (last BOS), Next news, R:R, Pip size.
Inputs (key)
Auto pip size: uses syminfo.mintick. Manual override available.
Risk:Reward (RR): default 2.0.
Pivot length: swing sensitivity.
Sessions: enable if you want signals only 12:00–20:00 (symbol timezone). Off = anytime.
News timezone: pick your own (e.g., Europe/Brussels, America/New_York).
Absolute & daily times: add your events (strings like 2025-09-17 20:00 or 14:30,16:00…).
Show labels/levels/OBs: toggle on/off.
Alerts included
BOS Bullish / BOS Bearish
BUY Entry / SELL Entry (return to 50% FVG)
Bullish OB revisit / Bearish OB revisit
TP Long/Short reached, SL Long/Short hit
NEWS WARNING (warning window only; does not block signals)
To use: Add Alert → Condition: this indicator → choose any of the alertconditions.
Best use
Bias: H1 for structure.
Execution: M15 (standard) or M5 (aggressive).
Works great on XAUUSD, but is symbol-agnostic (auto pip adapts).
Notes
News times display in the timezone you pick in settings.
OBs are a simple implementation meant for quick visual guidance.
Labels: BUY/SELL near entries, TP/SL on set and when hit, BOS up/down.
Risk disclaimer
This tool is for education only. Not financial advice. Backtest and manage risk.

Iani SMC Sniper XAU v2.2 (Long+Short + News Countdown, v6)Iani SMC Sniper XAU (v2.2) — smart-money logic for XAUUSD.
This indicator hunts “sniper entries” using a simple SMC sequence:
Sweep → BOS → 50% FVG entry
• After London session builds its range, we wait for a liquidity sweep (price dips below London Low for longs / wicks above London High for shorts).
• A BOS confirms direction (close breaks the last swing).
• First FVG that prints after BOS gives the entry at 50% (mid-gap).
• SL anchored to the protective swing (with a small safety buffer). TP is plotted using your Risk:Reward.
News countdown (non-blocking):
The script does not auto-fetch news; you set daily times (e.g., 14:30, 16:00) and/or specific dates (“YYYY-MM-DD HH:MM”). A countdown label shows “NEWS in Xm”. Signals are not blocked—this is just a safety heads-up for prop-firm rules.
Inputs: pivot length, RR, pip size (XAU default 0.10), session filter (after London), news times (recurring & absolute), show/hide levels & labels.
Plots & labels: London High/Low (daily), Entry/SL/TP lines, BOS/Sweep/BUY/SELL markers, news badge.
Alerts: BOS Bull/Bear, BUY/SELL Entry touch, TP/SL hit, NEWS WARNING.
Notes:
• Designed for XAUUSD intraday; works on other symbols if you adjust pip size.
• Uses symbol timezone; adjust your news times for DST if needed.
• Indicator only—no orders, no backtest. Manage risk and execution in MT5/your platform.
Changelog (v2.2): Pine v6, robust time parsing, one-line logical expressions (fixed EOL errors), mirrored short logic, cleaner London H/L reset, countdown label.
Disclaimer: Educational tool, not financial advice. Past performance ≠ future results.
Tags: SMC, ICT, XAUUSD, Gold, Liquidity Sweep, BOS, FVG, London Session, News, Intraday, Scalping, DayTrading.

Swing Oracle Stock 2.0- Gradient Enhanced# 🌈 Swing Oracle Pro - Advanced Gradient Trading Indicator
**Transform your technical analysis with stunning gradient visualizations that make market trends instantly recognizable.**
## 🚀 **What Makes This Indicator Special?**
The **Swing Oracle Pro** revolutionizes traditional technical analysis by combining advanced NDOS (Normalized Distance from Origin of Source) calculations with a sophisticated gradient color system. This isn't just another indicator—it's a complete visual trading experience that adapts colors based on market strength, making trend identification effortless and intuitive.
## 🎨 **10 Professional Gradient Themes**
Choose from carefully crafted color schemes designed for optimal visual clarity:
- **🌅 Sunset** - Warm oranges and purples for classic elegance
- **🌊 Ocean** - Cool blues and teals for calm analysis
- **🌲 Forest** - Natural greens and browns for organic feel
- **✨ Aurora** - Ethereal greens and magentas for mystique
- **⚡ Neon** - Vibrant electric colors for high-energy trading
- **🌌 Galaxy** - Deep purples and cosmic hues for night sessions
- **🔥 Fire** - Intense reds and golds for volatile markets
- **❄️ Ice** - Cool whites and blues for clear-headed decisions
- **🌈 Rainbow** - Full spectrum for comprehensive analysis
- **⚫ Monochrome** - Professional grays for focused trading
## 📊 **Core Features**
### **Advanced NDOS System**
- Normalized Distance from Origin of Source calculation with 231-period length
- Smoothed with customizable EMA for reduced noise
- Multi-timeframe confirmation with H1 filter option
- Dynamic gradient coloring based on oscillator position
### **Intelligent Visual Feedback**
- **Primary Gradient Line** - Main NDOS plot with dynamic color transitions
- **Gradient Fill Zones** - Beautiful color-coded areas for bullish, neutral, and bearish regions
- **Smart Transparency** - Colors adjust intensity based on market volatility
- **Dynamic Backgrounds** - Subtle gradient backgrounds that respond to market conditions
### **Enhanced EMA Projection System**
- 75/760 period EMA normalization with 50-period lookback
- Gradient-colored projection line for trend forecasting
- Toggleable display with advanced gradient controls
- Price tracking for precise level identification
### **Multi-Timeframe Analysis Table**
- Real-time trend analysis across 6 timeframes (1m, 3m, 5m, 15m, 1H, 4H)
- Gradient-colored cells showing trend strength
- Customizable table size and position
- Professional emoji indicators (🚀 UP, 📉 DOWN, ➡️ FLAT)
### **Signal System**
- **Gradient Buy Signals** - Triangle up arrows with intensity-based coloring
- **Gradient Sell Signals** - Triangle down arrows with strength indicators
- **Alert Conditions** - Built-in alerts for all signal types
- **7-Day Cycle Tracking** - Tuesday-to-Tuesday weekly cycle visualization
## ⚙️ **Customization Controls**
### **🎨 Gradient Controls**
- **Gradient Intensity** - Adjust color vibrancy (0.1-1.0)
- **Gradient Smoothing** - Control color transition smoothness (1-10 periods)
- **Dynamic Background** - Toggle animated background gradients
- **Advanced Gradients** - Enable/disable EMA projection and enhanced features
### **🛠️ Custom Color System**
- **Bullish Colors** - Define custom start/end colors for bull markets
- **Bearish Colors** - Set personalized bear market gradients
- **Full Theme Override** - Create completely custom color schemes
- **Real-time Preview** - See changes instantly on your chart
## 📈 **How to Use**
1. **Choose Your Theme** - Select from 10 professional gradient themes
2. **Configure Levels** - Adjust high/low levels (default 60/40) for your timeframe
3. **Set Smoothing** - Fine-tune gradient smoothing for your trading style
4. **Enable Features** - Toggle background gradients, candlestick coloring, and advanced EMA projection
5. **Monitor Signals** - Watch for gradient buy/sell arrows and multi-timeframe confirmations
## 🎯 **Trading Applications**
- **Swing Trading** - Perfect for identifying medium-term trend changes
- **Scalping** - Multi-timeframe table provides quick trend confirmation
- **Position Sizing** - Gradient intensity shows signal strength for risk management
- **Market Analysis** - Beautiful visualizations make complex data instantly understandable
- **Education** - Ideal for learning market dynamics through visual feedback
## ⚡ **Performance Optimized**
- **Smart Rendering** - Colors update only on significant changes
- **Efficient Calculations** - Optimized algorithms for smooth performance
- **Memory Management** - Minimal resource usage even with complex gradients
- **Real-time Updates** - Responsive to market changes without lag
## 🚨 **Alert System**
Built-in alert conditions notify you when:
- NDOS crosses above high level (Buy Signal)
- NDOS crosses below low level (Sell Signal)
- Multi-timeframe confirmations align
- Customizable alert messages with emoji indicators
## 🔧 **Technical Specifications**
- **PineScript Version**: v6 (Latest)
- **Overlay**: True (plots on main chart)
- **Calculations**: NDOS, EMA normalization, volatility-based transparency
- **Timeframes**: Compatible with all timeframes
- **Markets**: Stocks, Forex, Crypto, Commodities, Indices
## 💡 **Why Choose Swing Oracle Pro?**
This isn't just another technical indicator—it's a complete visual transformation of your trading experience. The gradient system provides instant visual feedback that traditional indicators simply can't match. Whether you're a beginner learning to read market trends or an experienced trader seeking clearer signals, the Swing Oracle Pro delivers professional-grade analysis with unprecedented visual clarity.
**Experience the future of technical analysis. Your charts will never look the same.**
---
*⚠️ Disclaimer: This indicator is for educational and informational purposes only. Past performance does not guarantee future results. Always conduct your own research and consider risk management before making trading decisions.*
**🔔 Like this indicator? Please leave a comment and boost! Your feedback helps improve future updates.**
---
**📝 Tags:** #GradientTrading #SwingTrading #NDOS #MultiTimeframe #TechnicalAnalysis #VisualTrading #TrendAnalysis #ColorCoded #ProfessionalCharts #TradingToo

Signal Generator: HTF EMA Momentum + MACDSignal Generator: HTF EMA Momentum + MACD
What this script does
This indicator combines a higher-timeframe EMA trend filter with a MACD crossover on the chart’s timeframe. The goal is to make MACD signals more selective by checking whether they occur in the same direction as the broader trend.
How it works
- On the higher timeframe, two EMAs are calculated (short and long). Their difference is used as a simple momentum measure.
- On the chart timeframe, the MACD is calculated. Crossovers are then filtered with two conditions:
1.They must align with the higher-timeframe EMA trend.
2.They must occur beyond a small “zero band” threshold, with a minimum distance between MACD and signal lines.
- When both conditions are met, the script can plot BUY or SELL labels. ATR is used only to shift labels up or down for visibility.
Visuals and alerts
- Histogram bars show whether higher-timeframe EMA momentum is rising or falling.
- MACD main and signal lines are plotted with optional scaling.
- Dotted lines show the zero band region.
- Optional large BUY/SELL labels appear when conditions are confirmed on the previous bar.
- Alerts can be enabled for these signals; they trigger once per bar close.
Notes and limitations
- Higher-timeframe values are only confirmed once the higher-timeframe candle has closed.
- Scaling factors affect appearance only, not the logic.
- This is an open-source study intended as a learning and charting tool. It does not provide financial advice or guarantee performance.

Supertrend0913This Pine Script (`@version=6`) combines **two Supertrend indicators** and a set of **moving averages (EMA & MA)** into one overlay chart tool for TradingView.
**Key features:**
* **Supertrend \ & \ :**
* Each has independent ATR period, multiplier, and ATR calculation method.
* Plots trend lines (green/red for \ , blue/yellow for \ ).
* Generates **buy/sell signals** when trend direction changes.
* Includes **alert conditions** for buy, sell, and trend reversals.
* **Moving Averages:**
* 6 EMAs (lengths 21, 55, 100, 200, 300, 400).
* 5 SMAs (lengths 11, 23, 25, 39, 200).
* Each plotted in different colors for trend visualization.
👉 In short: it’s a **combined trading tool** that overlays two configurable Supertrend systems with alerts plus multiple EMAs/SMAs to help identify trend direction, signals, and potential entry/exit points.

Big Player Buy/Sell SignalHow It Works:
Detects volume spikes over SMA of recent volume.
Signals a buy if there’s a green candle near a recent swing low on high volume (possible big player accumulation).
Signals a sell if there’s a red candle near a swing high on high volume (possible big player distribution).
This is a proxy, not a direct measure of institutional trades, but it often works surprisingly well in liquid markets like Nifty 50 or Bank Nifty.
If you want, I can make an advanced version that combines RSI, EMA, and first occurrence detection for higher accuracy in catching big player moves.
